View Your Scan in 3D and on the Map
Once your survey is uploaded to PolarWave Data, you can explore it as an interactive 3D model or as a colour map overlaid on a satellite map. This page covers how to interact with each view.
Not uploaded yet? Start with Visualise Your Survey Data first.
Switching Between Views
After opening a survey, use the Survey section in the left sidebar to navigate between views:
| View | Best for |
|---|---|
| Explorer | Satellite map with your scan overlaid as a colour grid — opens by default |
| 3D View | Interactive three-dimensional surface render — understanding the depth and shape of anomalies |
| Search | Upload a new survey file |
Explorer View (Default)
When you open a survey, Explorer opens automatically — your scan is displayed as a colour-coded grid overlaid on a live satellite map.
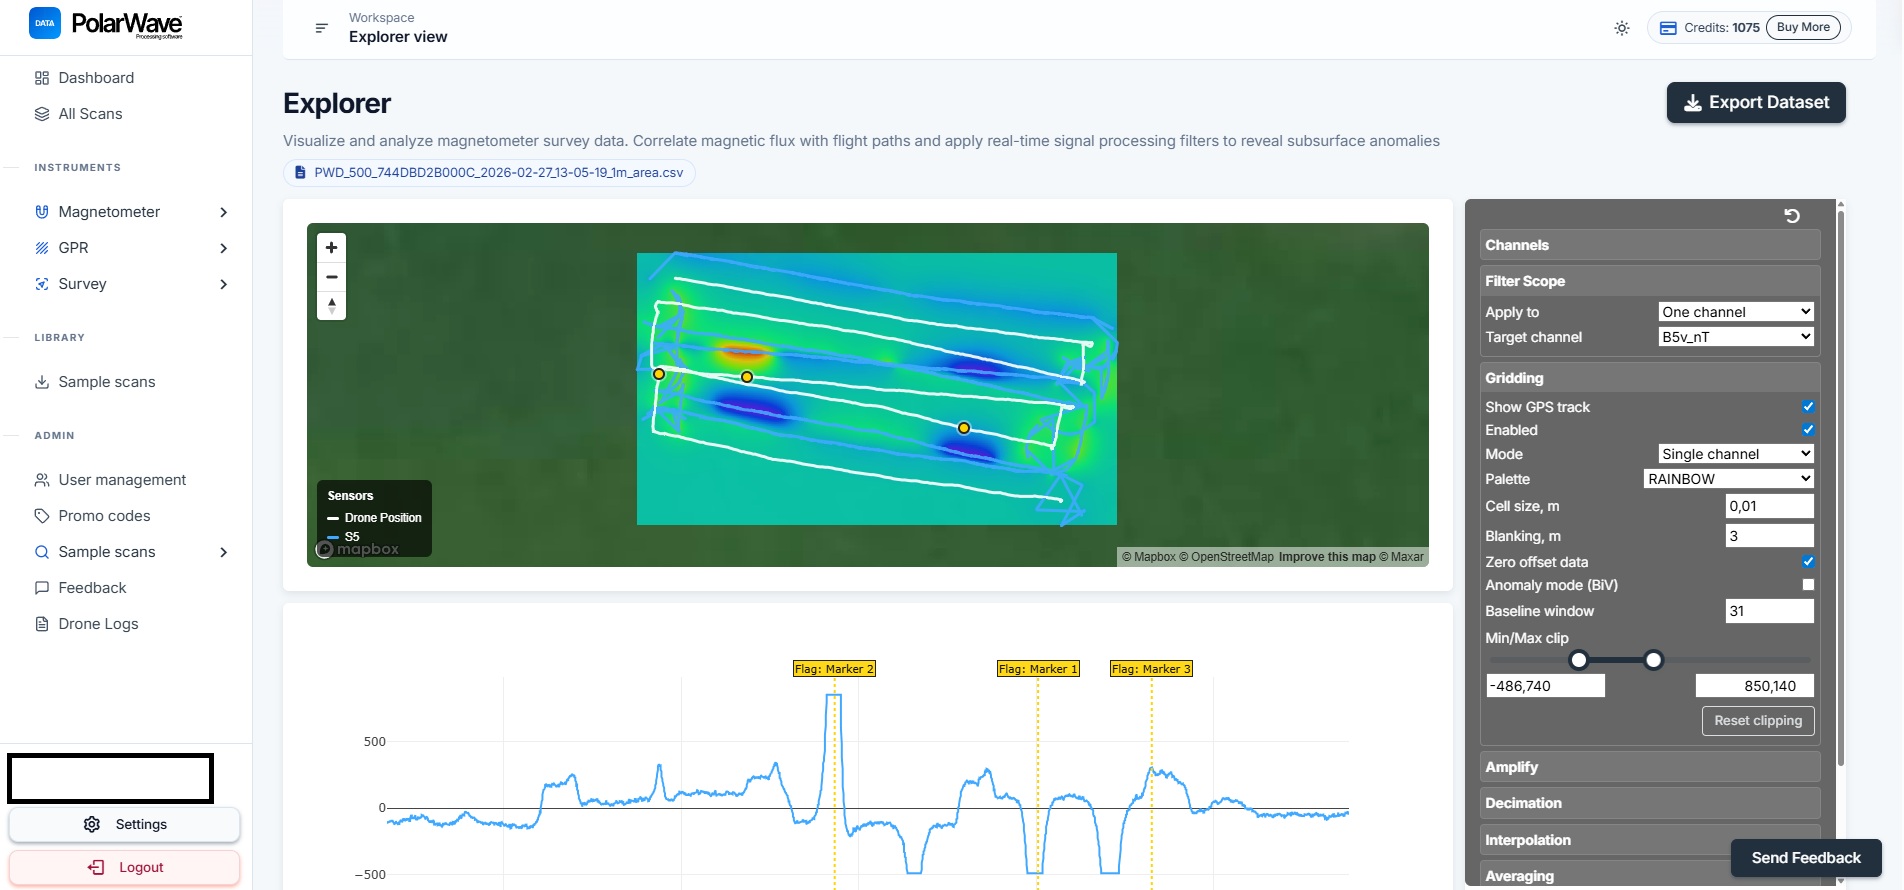
- The colour grid shows the intensity of the magnetic gradient across the surveyed area.
- Use the right-hand panel to adjust gridding settings, colour palette, and clipping range.
If you see only a GPS track line and no colour grid, gridding is not yet enabled. Toggle Gridding on in the right-hand panel.
The 3D View
To see the 3D surface model of your scan:
- Click 3D View in the left sidebar under the Survey section.

The 3D model renders the magnetic data as a three-dimensional surface — peaks and troughs represent variations in the measured gradient.
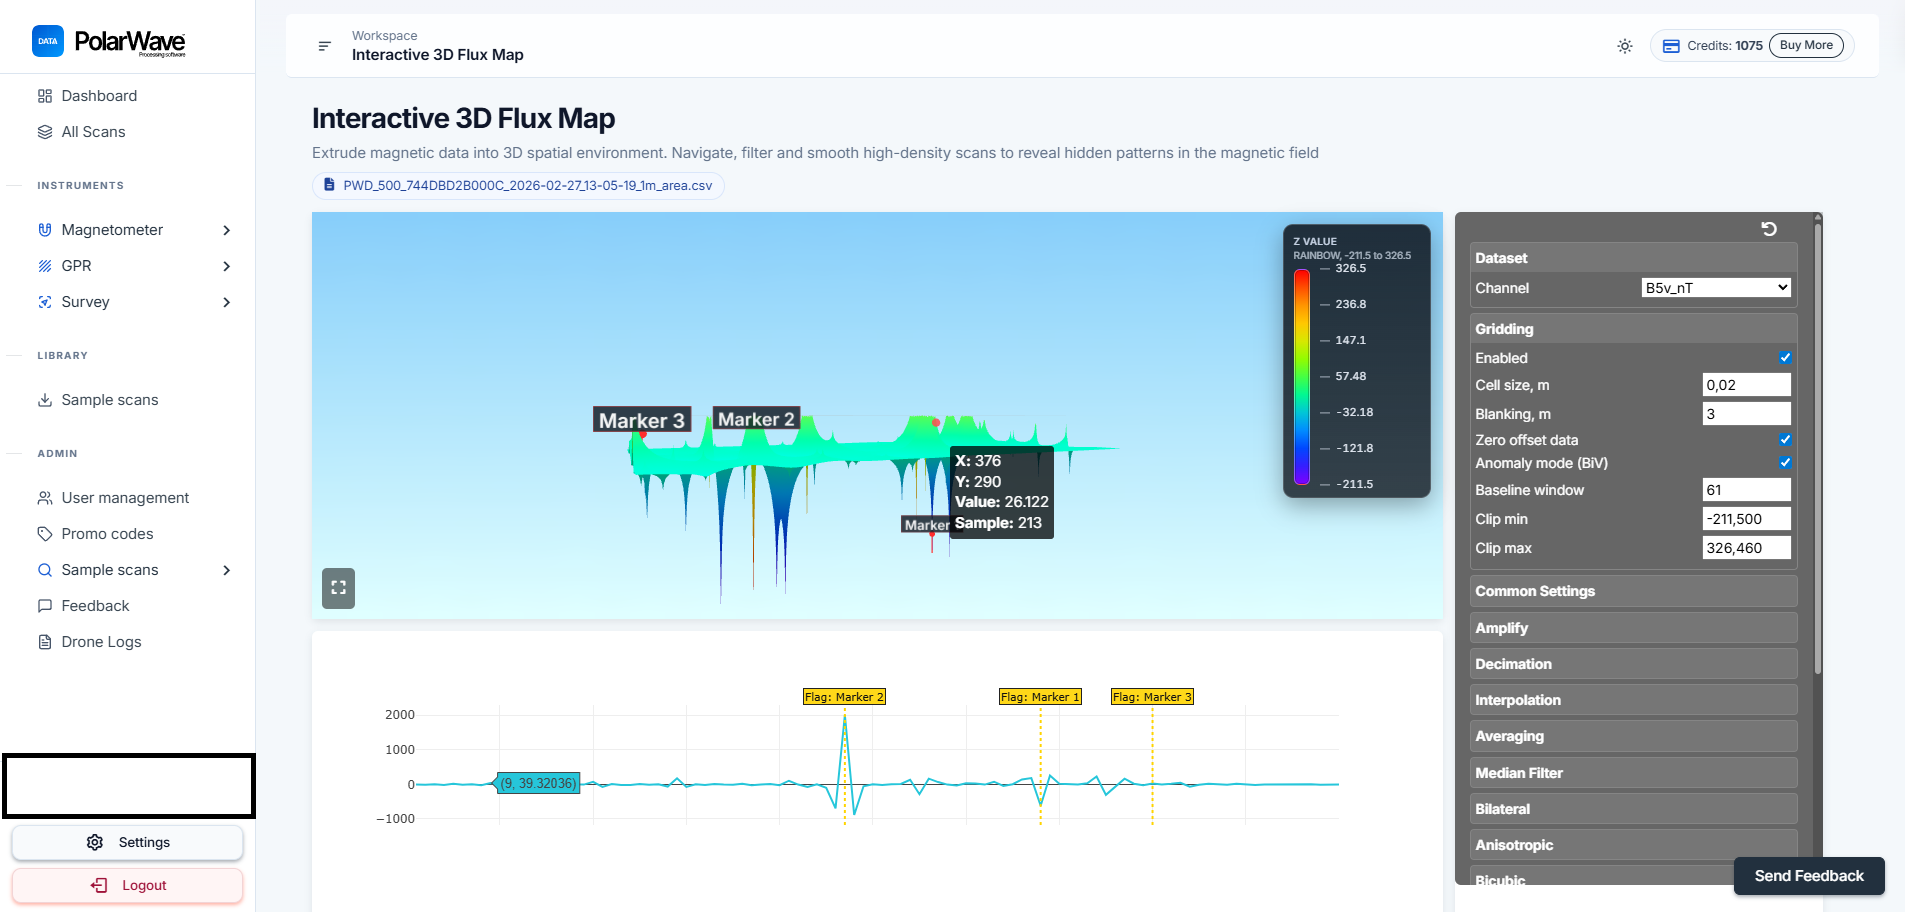
Interacting with the Model
| Action | How |
|---|---|
| Rotate | Click and drag to spin the model and examine it from any angle |
| Zoom | Scroll up and down to zoom in and out |
| Pan | Right-click and drag (or two fingers on a trackpad) to pan across the surface |
| Tags | Click on the graph to place tags on points of interest |
Selecting Channels
The FGA Logger records up to two fluxgate sensors, each with three axes plus the total vector magnitude. All available channels are shown at the top of the right-hand panel.
| Channel group | Description |
|---|---|
| B1x / B1y / B1z | Individual axis readings from Sensor 1 |
| B1v | Total vector magnitude from Sensor 1 |
| B2x / B2y / B2z | Individual axis readings from Sensor 2 |
| B2v | Total vector magnitude from Sensor 2 |
| Gx / Gy / Gz | Gradient between sensors on each axis |
| Gv | Total gradient vector magnitude |
Click All to display every channel, None to deselect all, or click individual channel tags to toggle them on and off. The views update immediately.
For most buried object detection surveys, use Gv (total gradient) — it combines all three axes into a single value that is most sensitive to localised anomalies.
The Explorer Map View
Enable Gridding
If the map shows only a GPS track line, gridding needs to be switched on:
- Look at the right-hand panel in Explorer view.
- Find the Gridding toggle and switch it on.
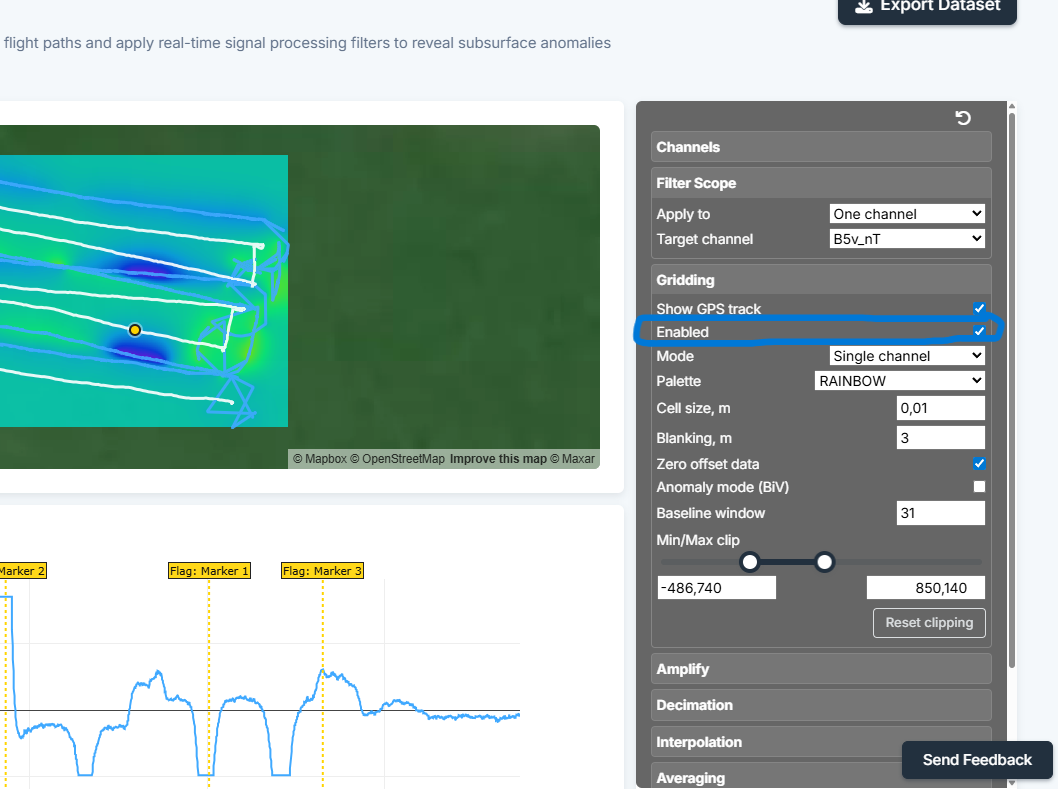
- The map will update within a few seconds, displaying your scan as a colour-coded grid overlaid on the satellite map.
If your gridded map looks patchy or has large blank areas, it usually means survey lines were spaced too far apart. Tighter line spacing during the survey gives a smoother, more complete grid.
Continue to Analyse and Map Your Scan to fine-tune filters and gridding settings.