Visualise Your Survey Data
This guide applies exclusively to the FG Sensors DIY Gradiometer Kit. Other sensors and loggers use different workflows.
The FG Sensors DIY Gradiometer Kit captures magnetic field data during a ground survey. Once your survey is complete, you upload the raw data file to PolarWave Data — a browser-based platform — which handles processing and gives you three powerful ways to explore your results:
- 3D surface model — an interactive render showing the depth and shape of anomalies
- 2D colour map — a flat top-down view for spatial analysis
- Map overlay — your scan placed on a live satellite map using GPS coordinates
What You Need
- A completed survey — raw data file exported from your DIY Gradiometer Kit
- A modern web browser (Chrome, Firefox, Edge, or Safari)
- A PolarWave Data account at polarwave.app
- GPS data embedded in your file — required for the Map view (most kit exports include this automatically)
Step 1: Create Your PolarWave Data Account
PolarWave Data is the web platform used to process and visualise data from your FG Sensors kit. No software installation is needed.
- Open your browser and go to polarwave.app
- Click Sign Up to create a free account, or Sign In if you already have one.
- Once logged in, you will see the main dashboard with your data library.
Step 2: Export Your Data File from the Kit
Before uploading, make sure your data file is ready:
- File format: PolarWave Data accepts the standard output format from the FG Sensors kit. The file is typically saved directly to an SD card or transferred via USB.
- GPS: Confirm that GPS logging was active during your survey. Without GPS coordinates, the Map view will not be available.
- File name: Keep the original filename — it helps PolarWave Data auto-detect the device type.
If you are unsure whether GPS was recorded, open the file in a text editor and look for latitude/longitude columns or NMEA sentences near the top.
Step 3: Upload to PolarWave Data
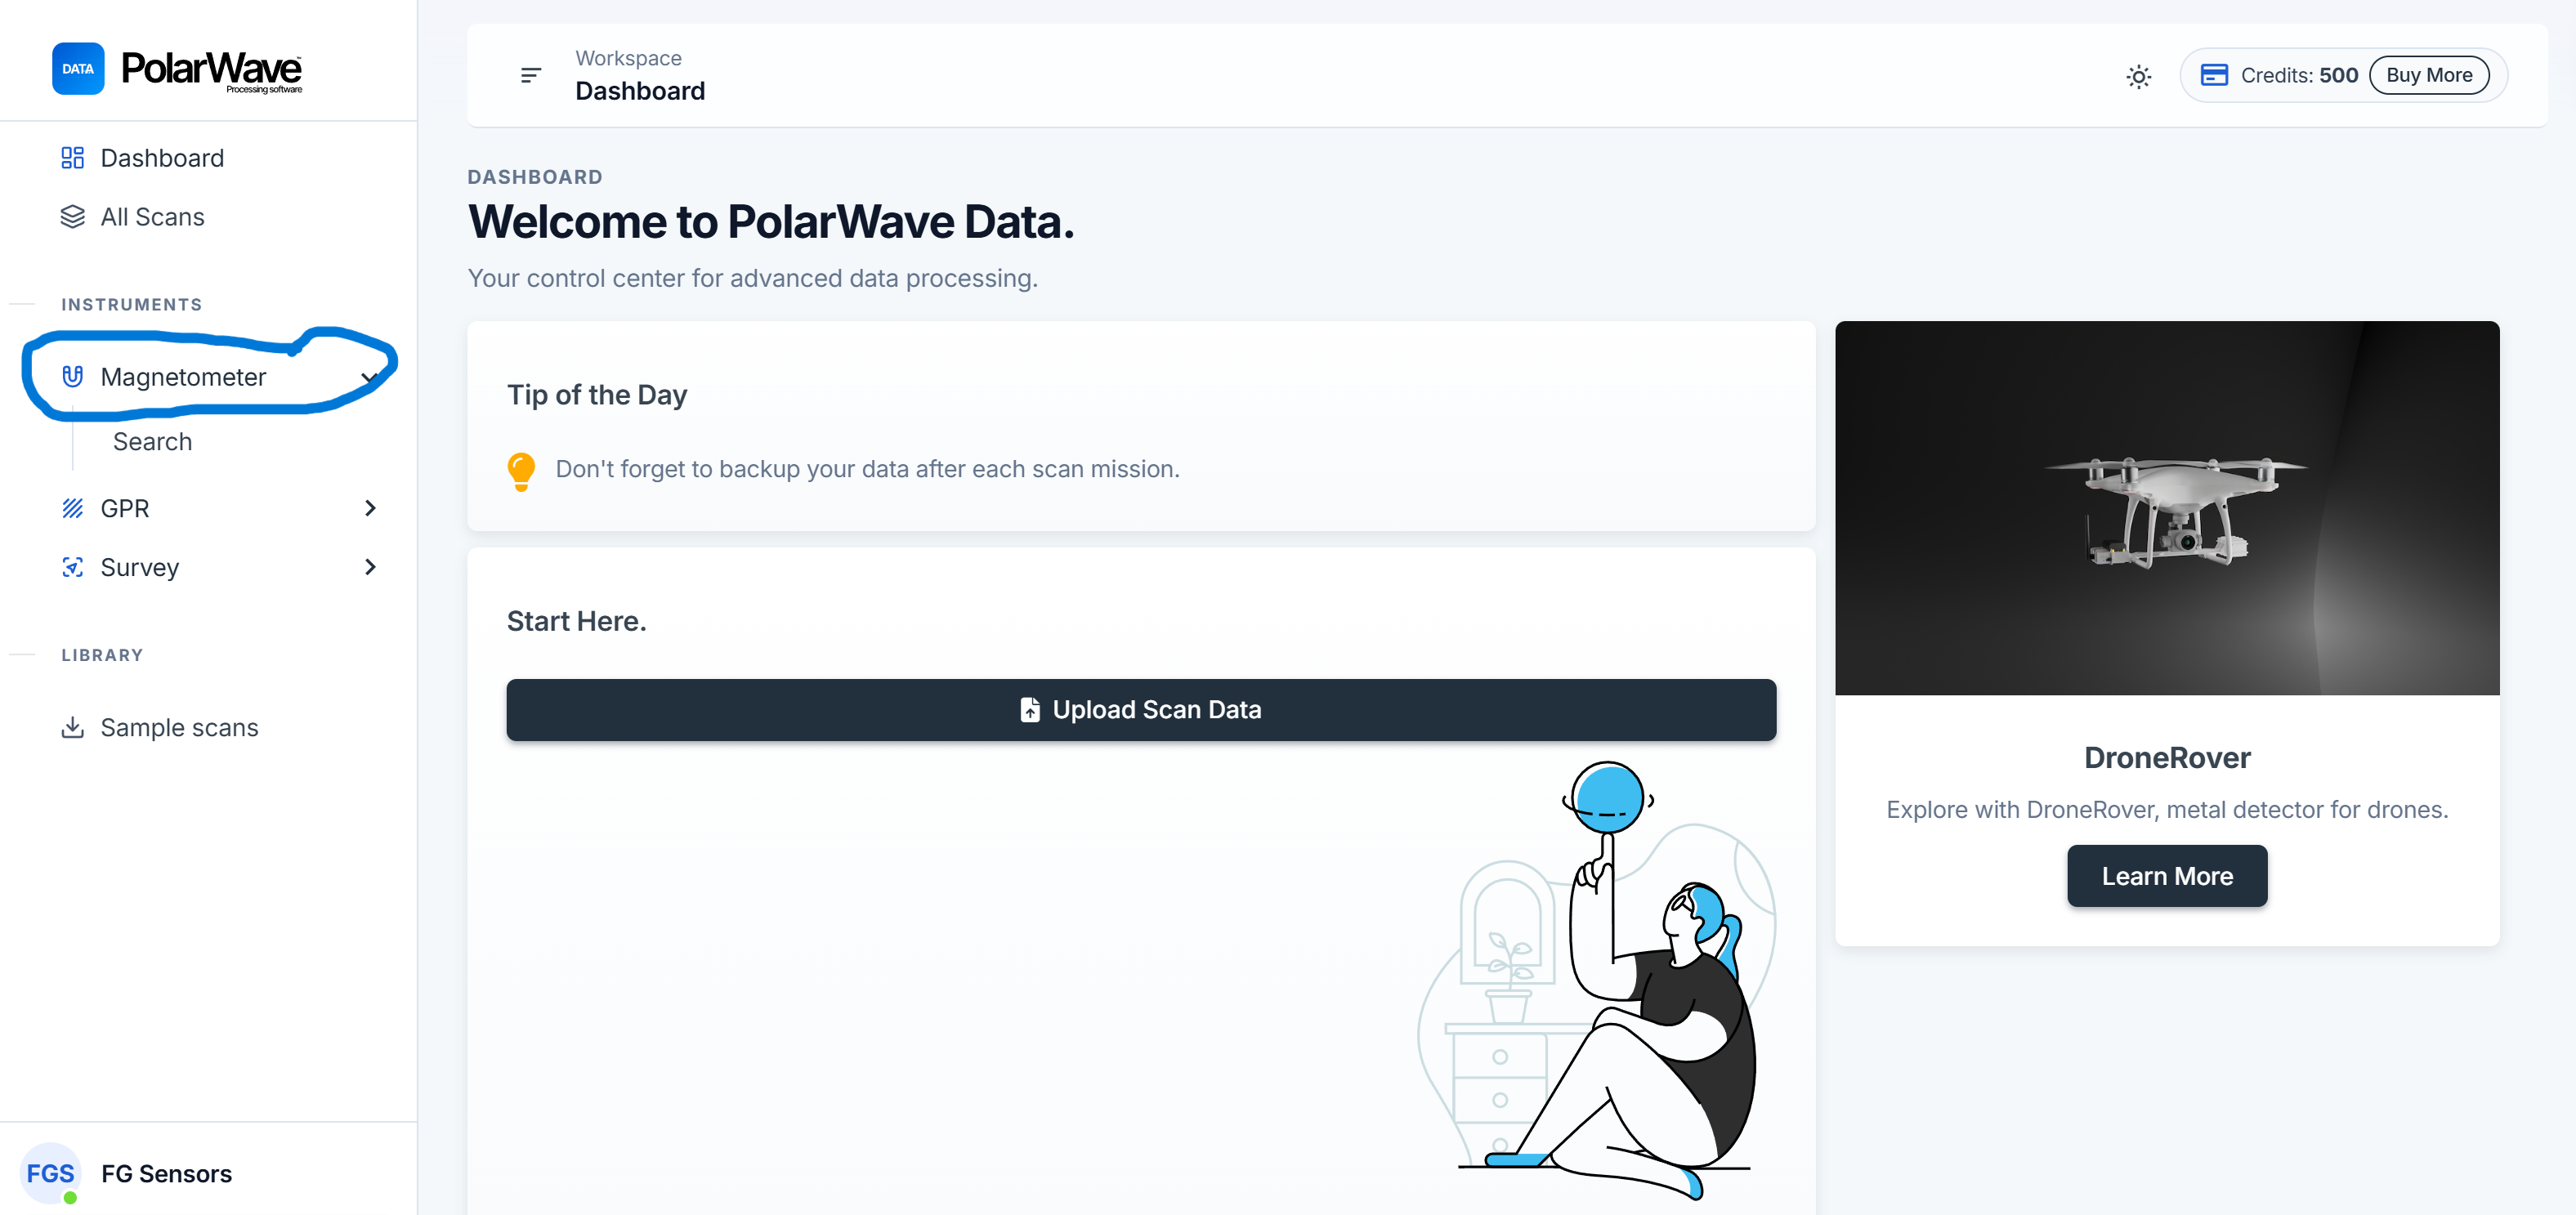
- From the PolarWave Data dashboard, click Magnetometer in the left navigation menu.
-
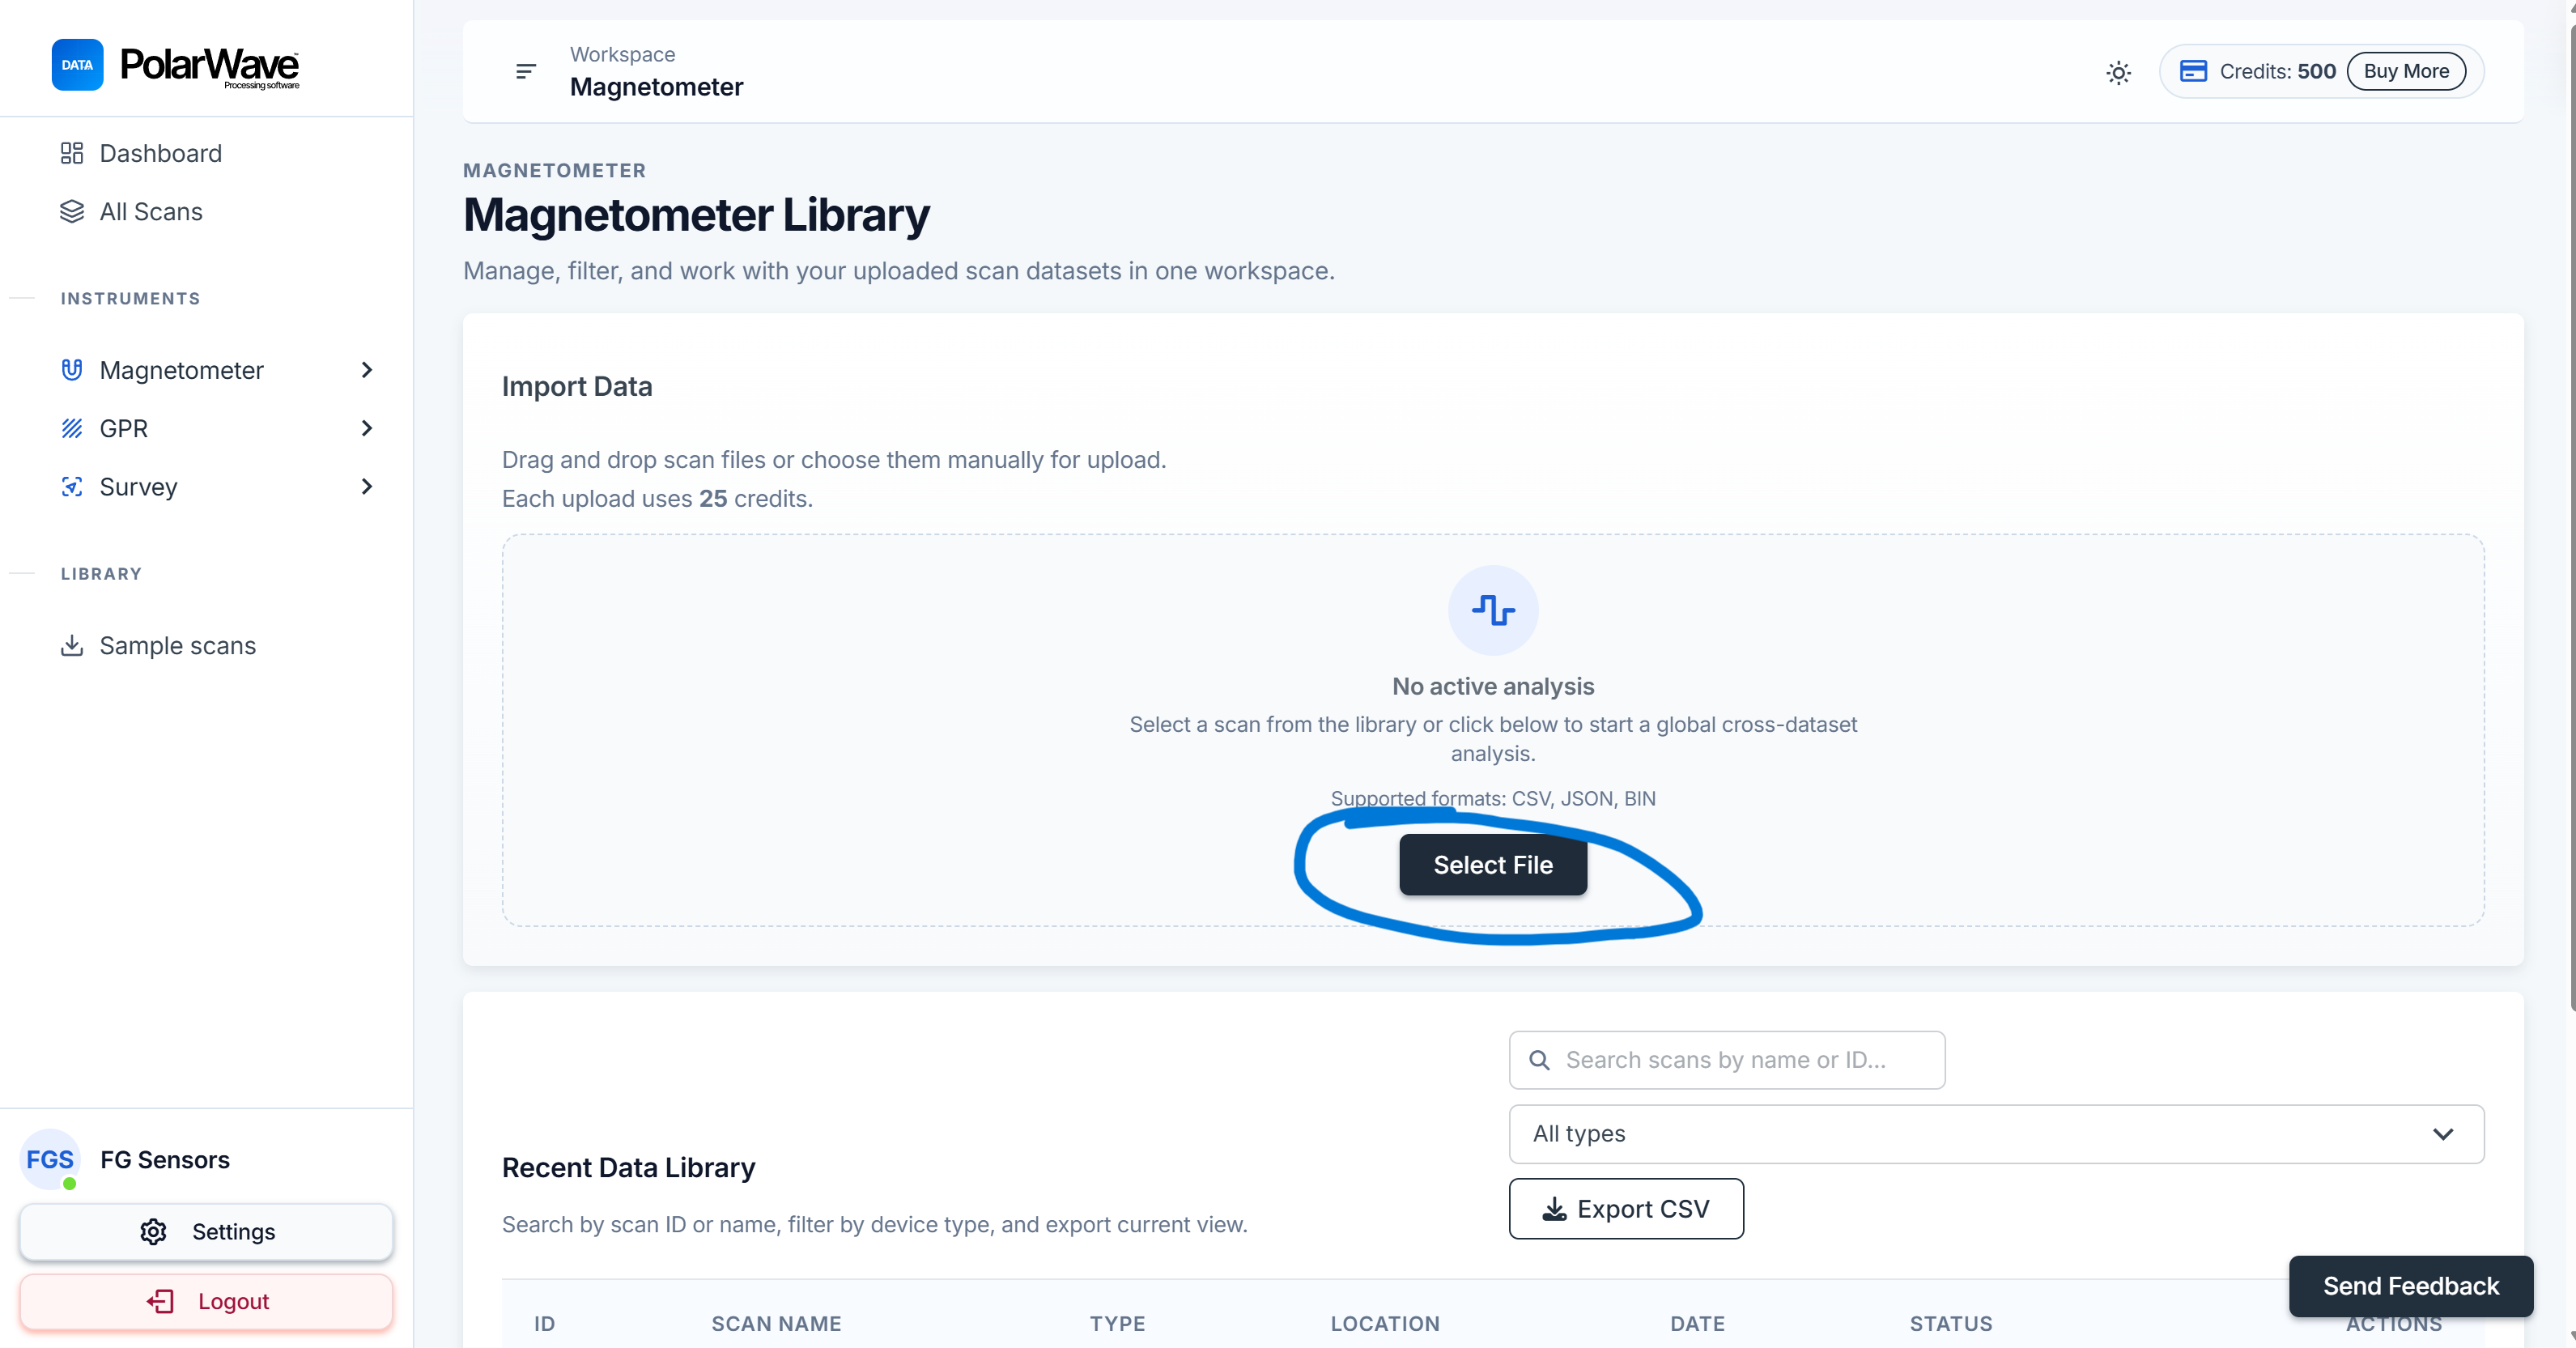
Click the Search button to open the upload panel.
-
Click Select File — or drag and drop your data file directly into the upload area.
- In the Device Type dropdown, select your FG Sensors kit model.
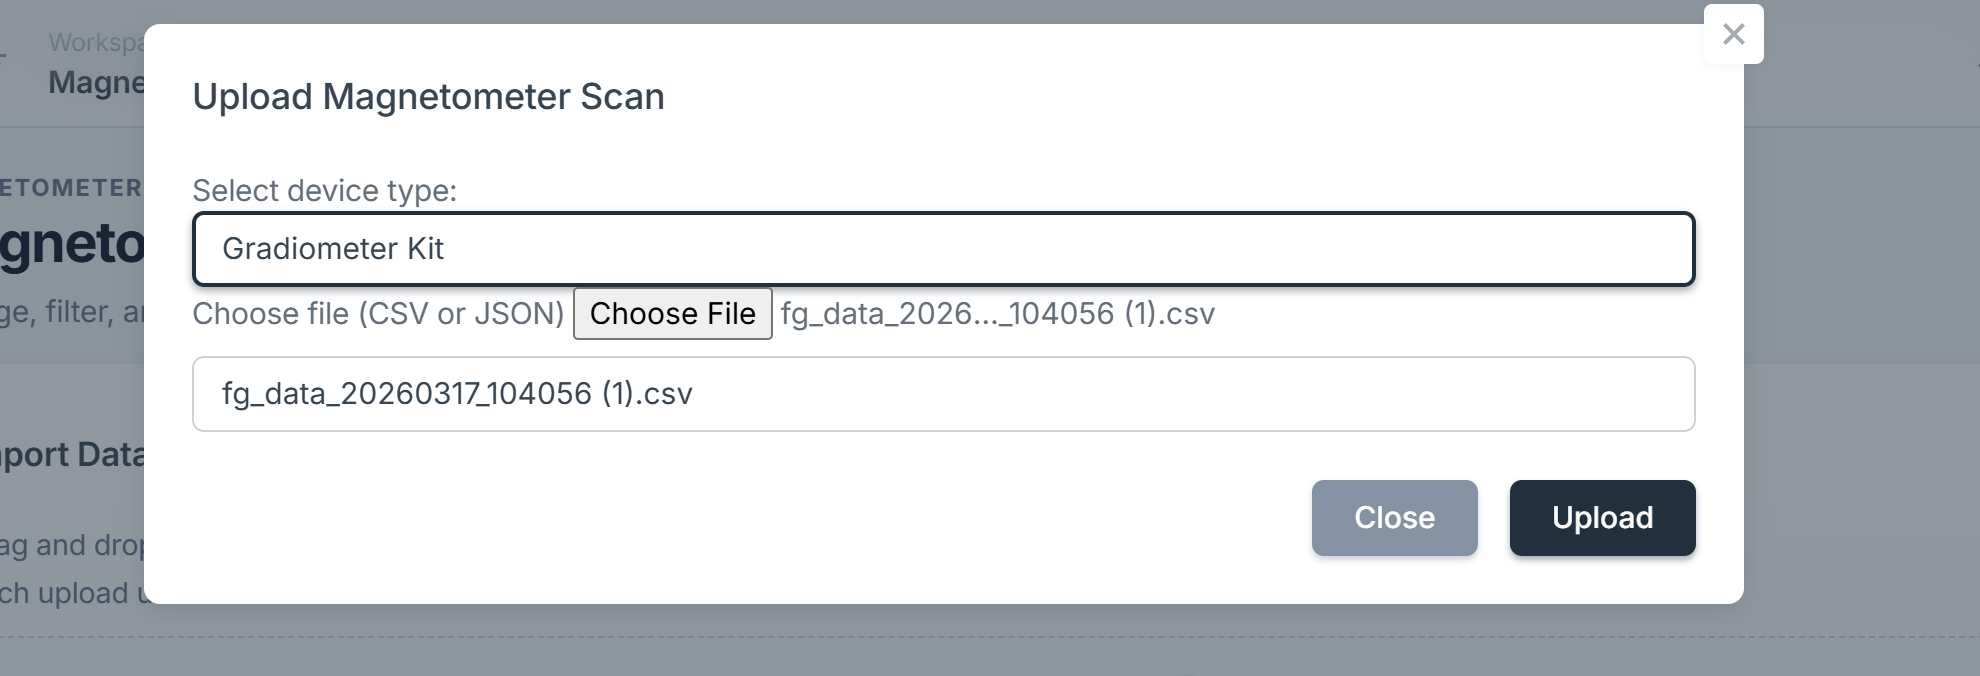 If you are unsure, leave it unset — PolarWave Data will identify the format automatically.
5. Click Upload. A progress bar will appear while the file transfers and processes.
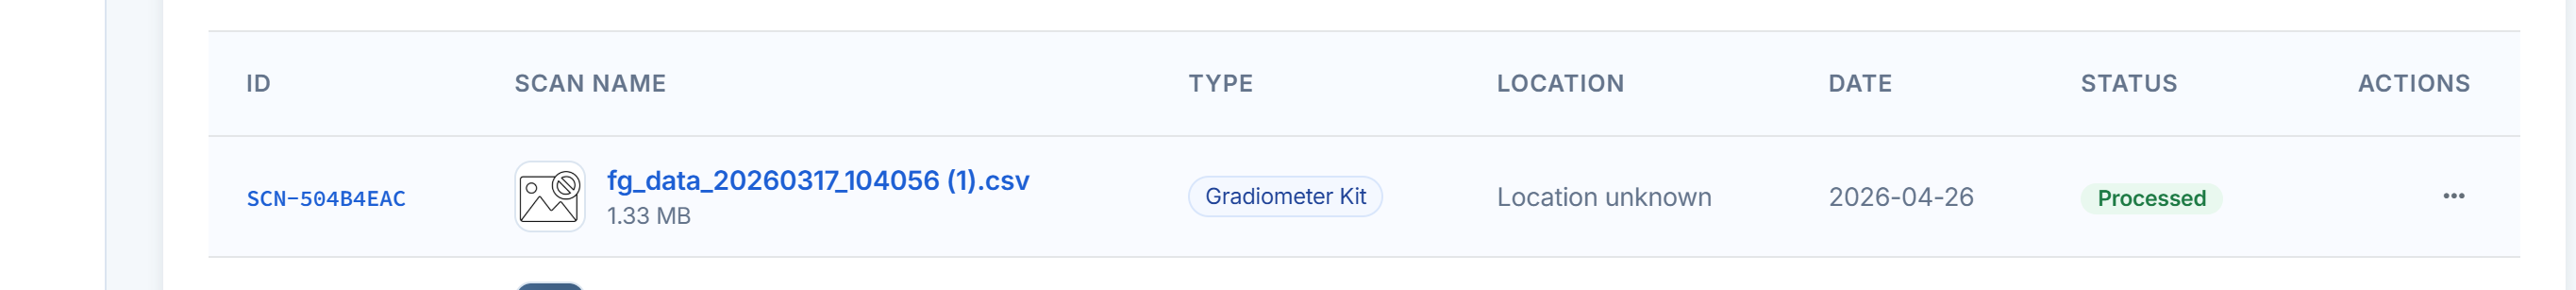
6. Once complete, your survey will appear as a new entry in the Data Library.
If you are unsure, leave it unset — PolarWave Data will identify the format automatically.
5. Click Upload. A progress bar will appear while the file transfers and processes.
6. Once complete, your survey will appear as a new entry in the Data Library.
Processing time depends on file size. Most surveys from the FG Sensors kit complete within a few seconds to a minute.
Step 4: Open Your Scan
- In the Data Library, click on the name of your newly uploaded survey.
- The main viewer will open showing your scan in 3D view by default — a three-dimensional surface render of the magnetic data.
- Below the 3D model you will see a 1D graph showing the raw signal along each survey line. Use this to spot strong anomalies at a glance.
Continue to View Your Scan in 3D and on the Map to interact with your results.